Program Profiling Using Systemtap
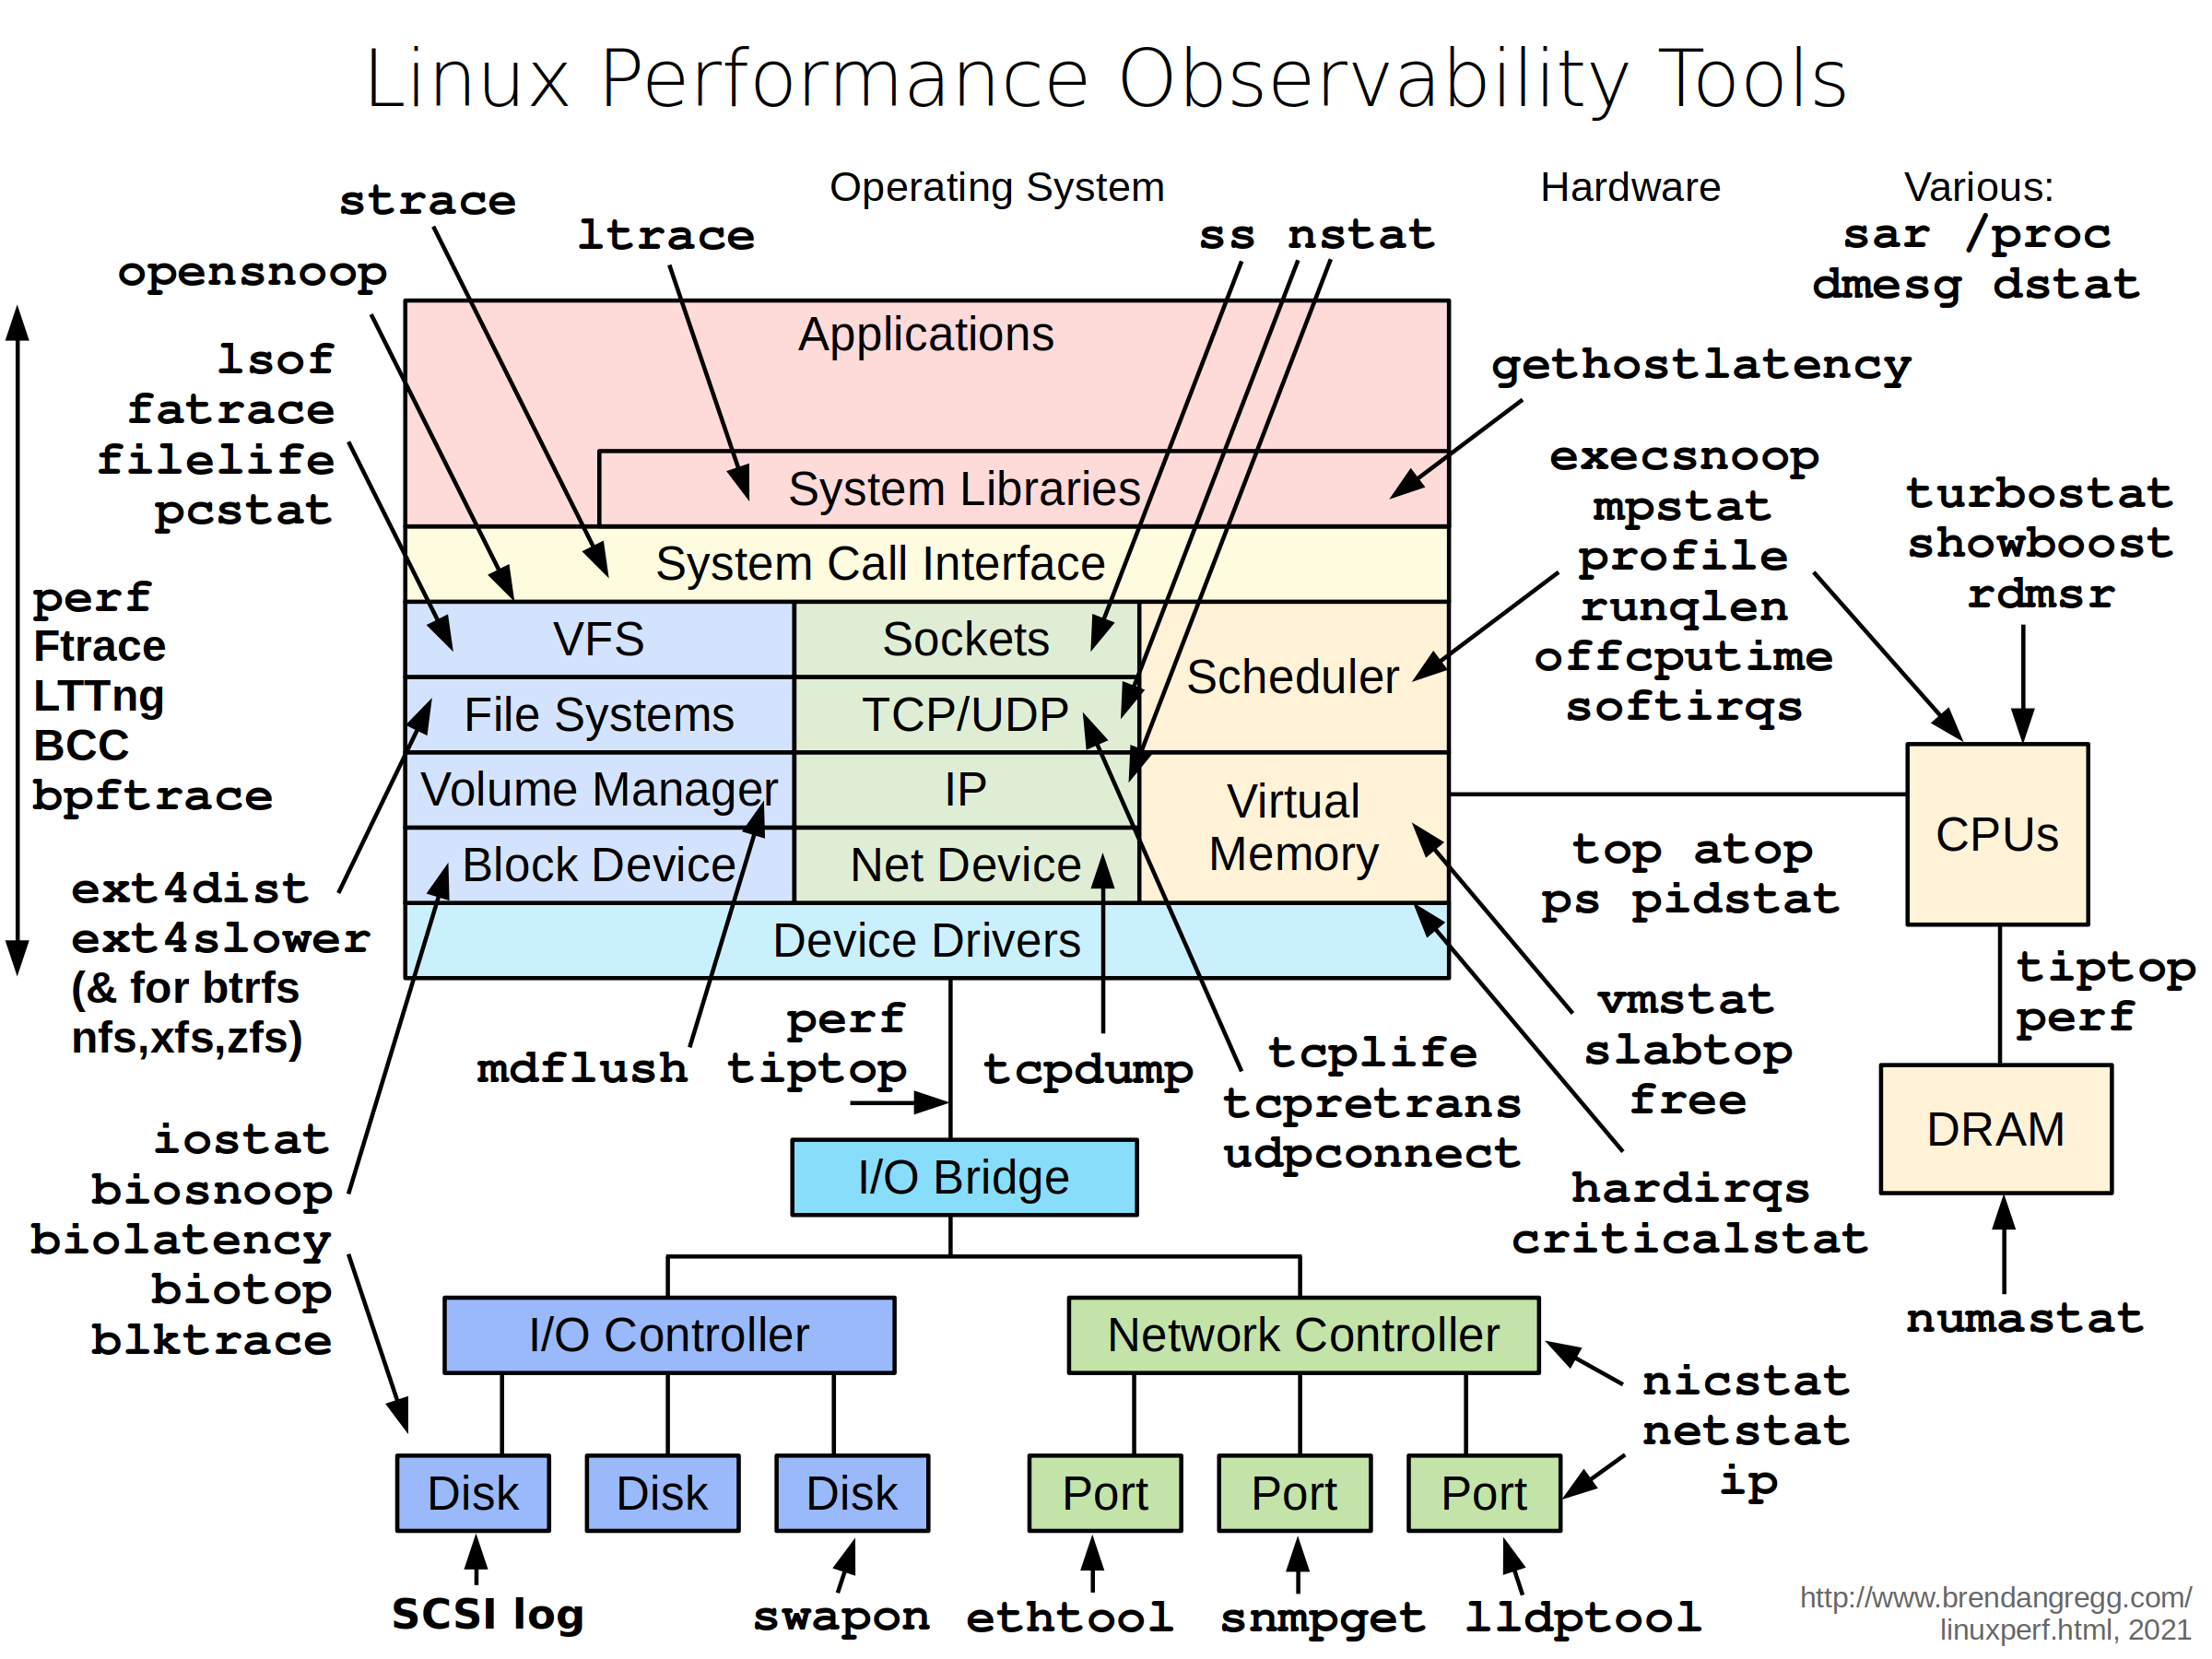
SystemTap (stap) is both scripting language and tool for profiling program on Linux kernel-based operation system. The most important feature is its ability to probe user-land function, different from tools like strace and perf which can only or partly support user-land probing. You can find what it can do in the latest Linux performance tools graph:

Stap supports c++ and c. For java, it may support it from RHEL7 according to this. The key is the systemtap-runtime-java package, which I don’t see it in RHEL6 repo.(Yeah, I use RHEL6.)
##Install Guide
- Make sure utrace is enabled in your OS. By default, RHEL should has this option open. But it’s better to double check.
grep CONFIG_UTRACE /boot/config-`uname -r` -
Install required kernel package, including kernel-debuginfo, kernel-debuginfo-common, kernel-devel (Optional if you only use user-land probe)
- Install debug info for program ls, which we will use as a test.
debuginfo-install `rpm -qf /bin/ls` - Test whether the installation works and user-land probe is enabled. If succeed, it should print out a line “hello world!”
sudo stap -e 'probe process("ls").function("main") { printf("hello world!\n"); }' -c ls##Usage Guide
You don’t need to learn stap language very well to use it. There are many good resources on Github. I mainly use scripts from agentzh, who is pretty active on performance tuning using stap. Blow are his two repositories I use:
Although this repo is mainly for nginx performance tuning, there are also many for general purpose usage. Here I use the sample-bt and sample-bt-off-cpu to generate the FlameGraph.
- On-CPU Flame Graph
sample-bt could be used to generate in-CPU graph. This graph shows how your program consume CPU cycles from the perspective of functions. Follow the instruction here.
For example, below graph is got from profiling redis server. From the graph, you can clearly see what redis is doing and which funciton consume the most cpu cycles. Some of the functions may not be optimizable, but most of the time you are able to find the bottomneck or some program fault. Click that function, you can follow the stacktrace further.
# example used to show systemtap use case
# All the use cases use the same program and running paramaters.

# redis-server opens in localhost
# redis-benchmark runs like:
./redis-benchmark -r 10000000 -n 2000000 -t get -P 16 -q

# For more details about redis-benchmark commands please refer to http://redis.io/topics/benchmarks.ATTENTION: For C++ program, we need to unmangle the .bt file. Please run cat [bt file] | c++filt -n > [output bt file]

- Off-CPU Flame Graph
sample-bt-off-cpu could be used to generate off-CPU graph, which shows all the blocking(or latency) come from. Then running process is exactly the same with sample-bt.
The Off-CPU flame graph is a pretty good startpoint for latency analysis. Personally I have a user case here. After a newest feature been pushed to production, we notice the latency went pretty high. Then we got the off-cpu flame graph of the app and find out one specific funtion consumed most of the time. Following that, we found out there is some wrong with our cache layer once under high traffic and finally fixed that. The off-cpu flame graph really helps us quickly target the root casue and also give us a clear picture whether the application is doing the right thing.
Here is a flame graph of redis

FlameGraph is pretty powerful in performance tuning, since it could give you a overview of the program without any domain-specific knowledge. Need to mention that FlameGraph is independent of stap, you can definitely use other tools to generate flameGraph. Please check following links.
###stapxx
stapxx is a macro language built on top of stap, which provide more functionalities and easier to use. For more detail, please review the main page. Here I mainly use the func-latency-distr script. The usage is very clear here.https://github.com/openresty/stapxx#func-latency-distr
For example, below is a comparison I did using func-latency-distr.sxx to show how big the cross-colo latency is:
# the latency of lookupKeyRead function in redis codebase.
sudo ./func-latency-distr.sxx -x 10995 --arg func='@pfunc(lookupKeyRead)'

Start tracing 10995 (/home/lniu/redis-2.8.13/src/redis-server)
Hit Ctrl-C to end.
^CDistribution of lookupKeyRead latencies (in nanoseconds) for 1859762 samples
max/avg/min: 248455/6884/5955
 value |-------------------------------------------------- count
  1024 |                                                         0
  2048 |                                                         0
  4096 |@@@@@@@@@@@@@@@@@@@@@@@@@@@@@@@@@@@@@@@@@@@@@@@@@  1764146
  8192 |@@                                                   80367
 16384 |                                                     14996
 32768 |                                                       228
 65536 |                                                        22
131072 |                                                         3
262144 |                                                         0
524288 |                                                         0
Please leave a message if you have any questions. I am glad to help :)